Stock Take Sheet
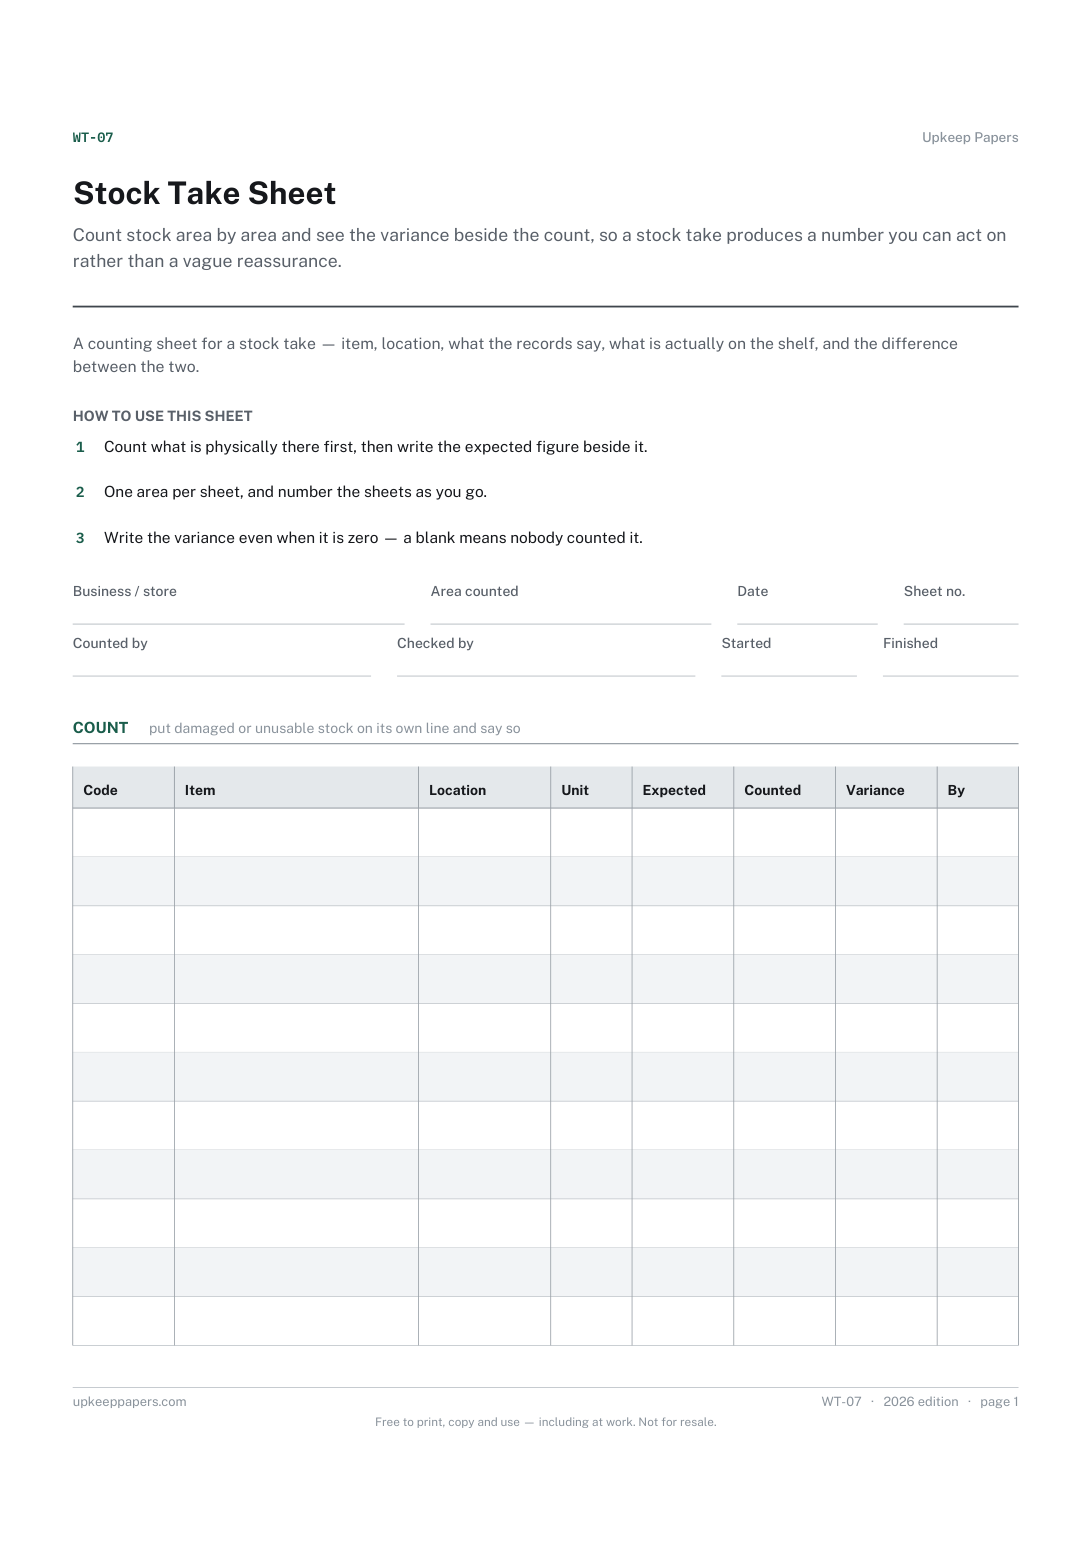
Count stock area by area and see the variance beside the count, so a stock take produces a number you can act on rather than a vague reassurance.
WT-07 1 page
Everything here is free. Making it takes time and money. Everything here is free.
 Buy us a coffee
 Food preservation and pantry · HP-01
A free printable pantry stock sheet — item, unit, par level, current count, opened and best before dates, reorder flag and supplier, one line per staple.

One page. Choose your paper size — both versions are laid out identically, so neither one gets shrunk to fit.
Print it and write on it
Fill it in type and save
The fillable versions have real form fields — open them in any PDF reader, type into them and save. Printing help.
See at a glance what has fallen below the level you want to keep, so staples get reordered before a recipe stops and duplicates stop accumulating behind them.
Households running a stocked pantry, shared houses, holiday lets, and anyone who shops for a cupboard rather than for a single meal.
One page, top to bottom:
Printed under the title: What is on the shelf, how much of it you want there, and what needs reordering before it runs out mid-recipe. One line per item, counted and dated.
Your figures, not ours. A par level is the number of something you want to have in stock before you buy more. It is yours to set, and it depends on how you cook and how often you shop. No storage times, keeping guidance or best-before figures are printed here either — those belong to the packet in front of you and to advice where you live. This sheet holds a count against a level you chose.
Write-on lines: Household or premises · Store, cupboard or shelf · Counted by · Date
Table, 13 rows: Item · Unit · Par · Count · Checked · Opened · Best before · Reorder · Supplier
The quantity of something you want to have in stock before you top it up. It is your own decision and it depends on how you cook, how far the shops are and how often you go — which is why the sheet asks for it rather than printing one.
No, and deliberately so. Keeping times depend on the product, the packaging and how it is stored, and food safety guidance differs between countries. The sheet has columns for the opened date and the best before printed on the packet; the packet and guidance where you live are the source for what those mean.
Count stock area by area and see the variance beside the count, so a stock take produces a number you can act on rather than a vague reassurance.
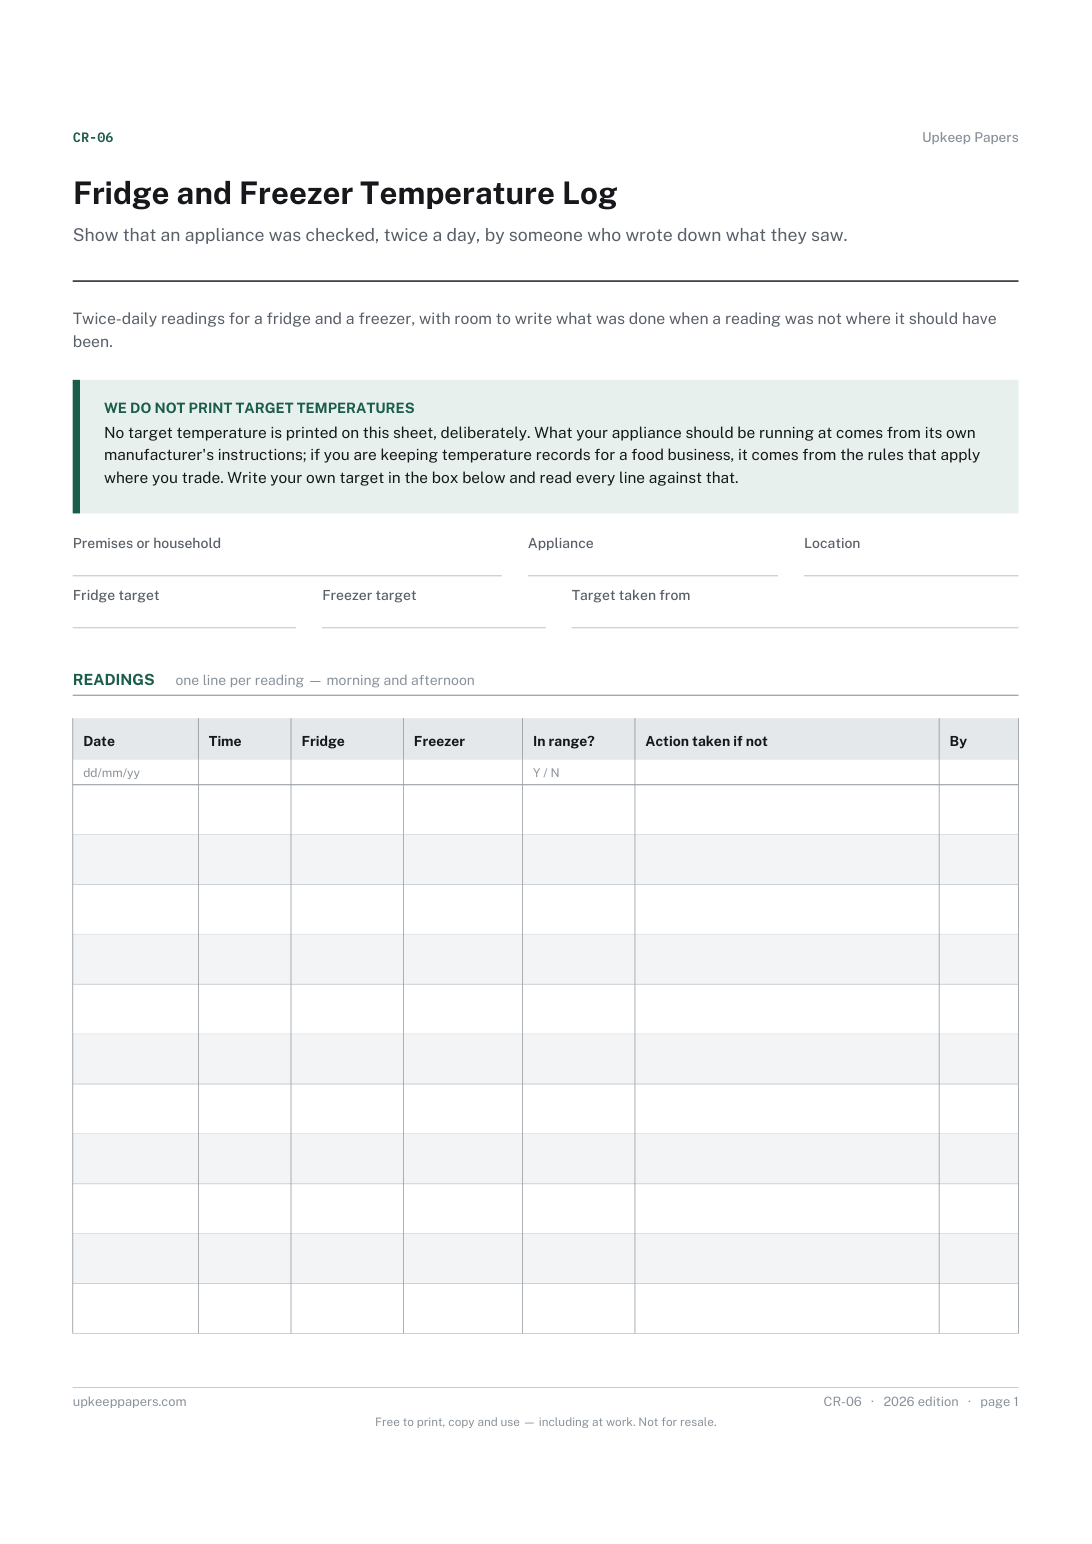
Show that an appliance was checked, twice a day, by someone who wrote down what they saw. A run of readings shows drift long before one reading shows a failure.
Turn a season of odd handfuls and full trugs into one running total per crop, so next year's planting is decided by what the plot produced rather than by memory.
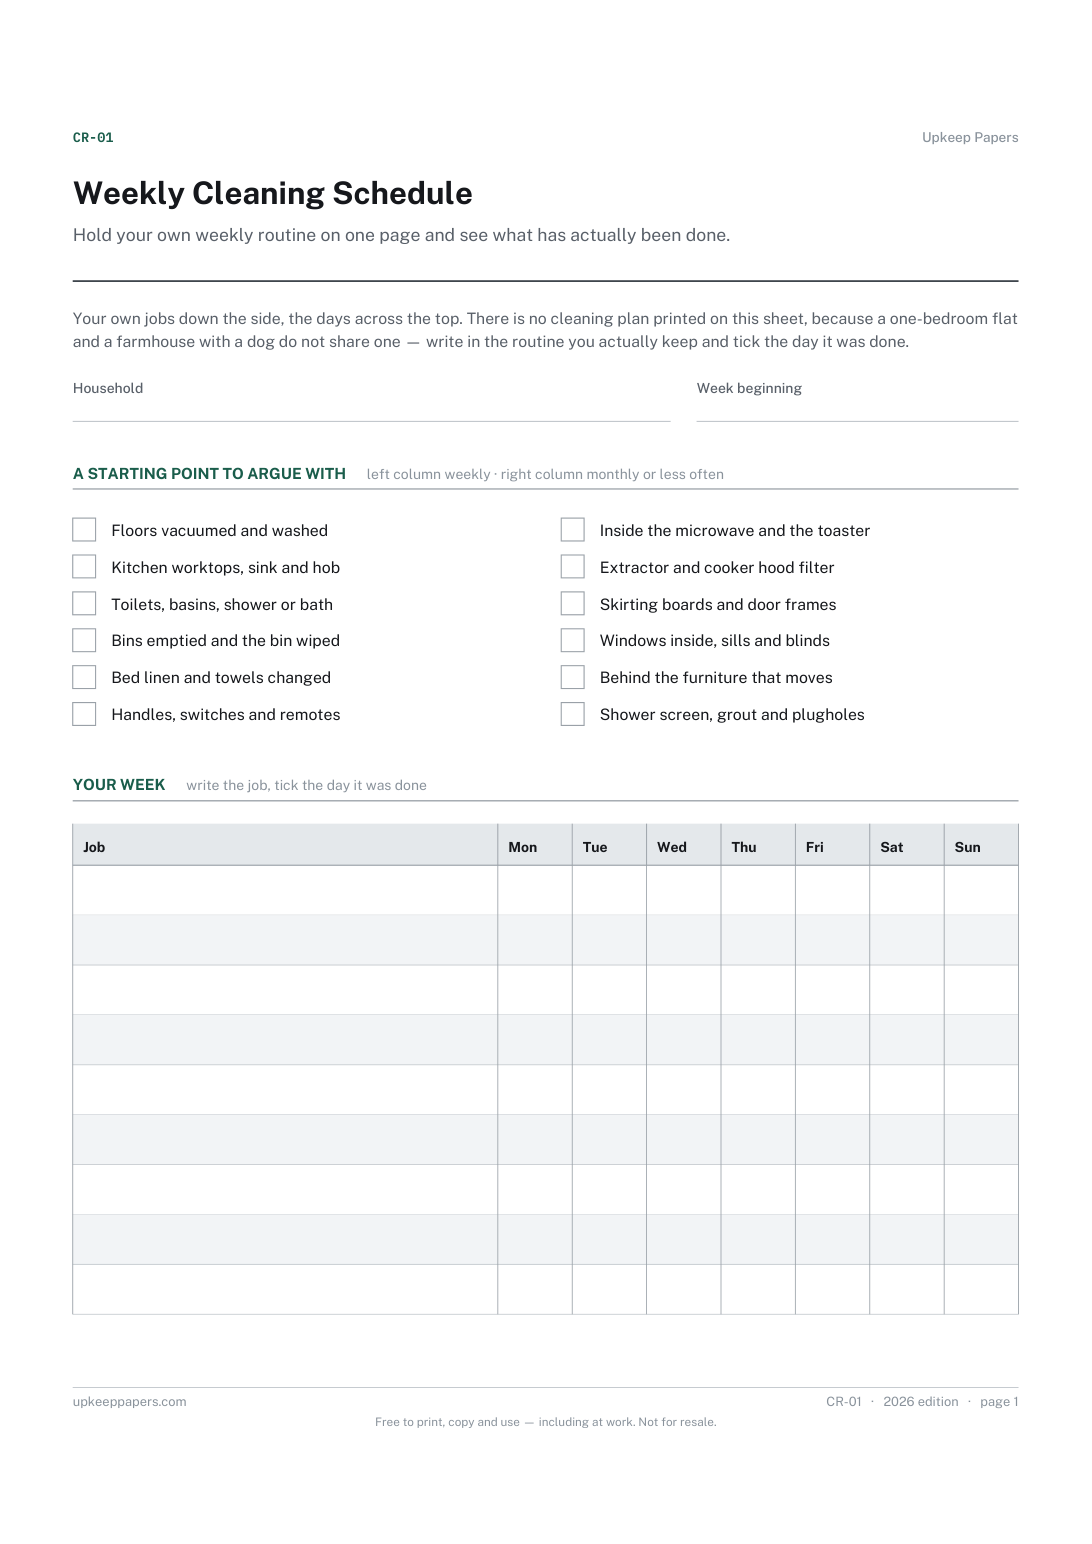
Hold your own weekly routine on one page and see what has actually been done. The jobs are yours to write in; the grid is the part worth printing.
The same subject, with a version you can fill in on screen.
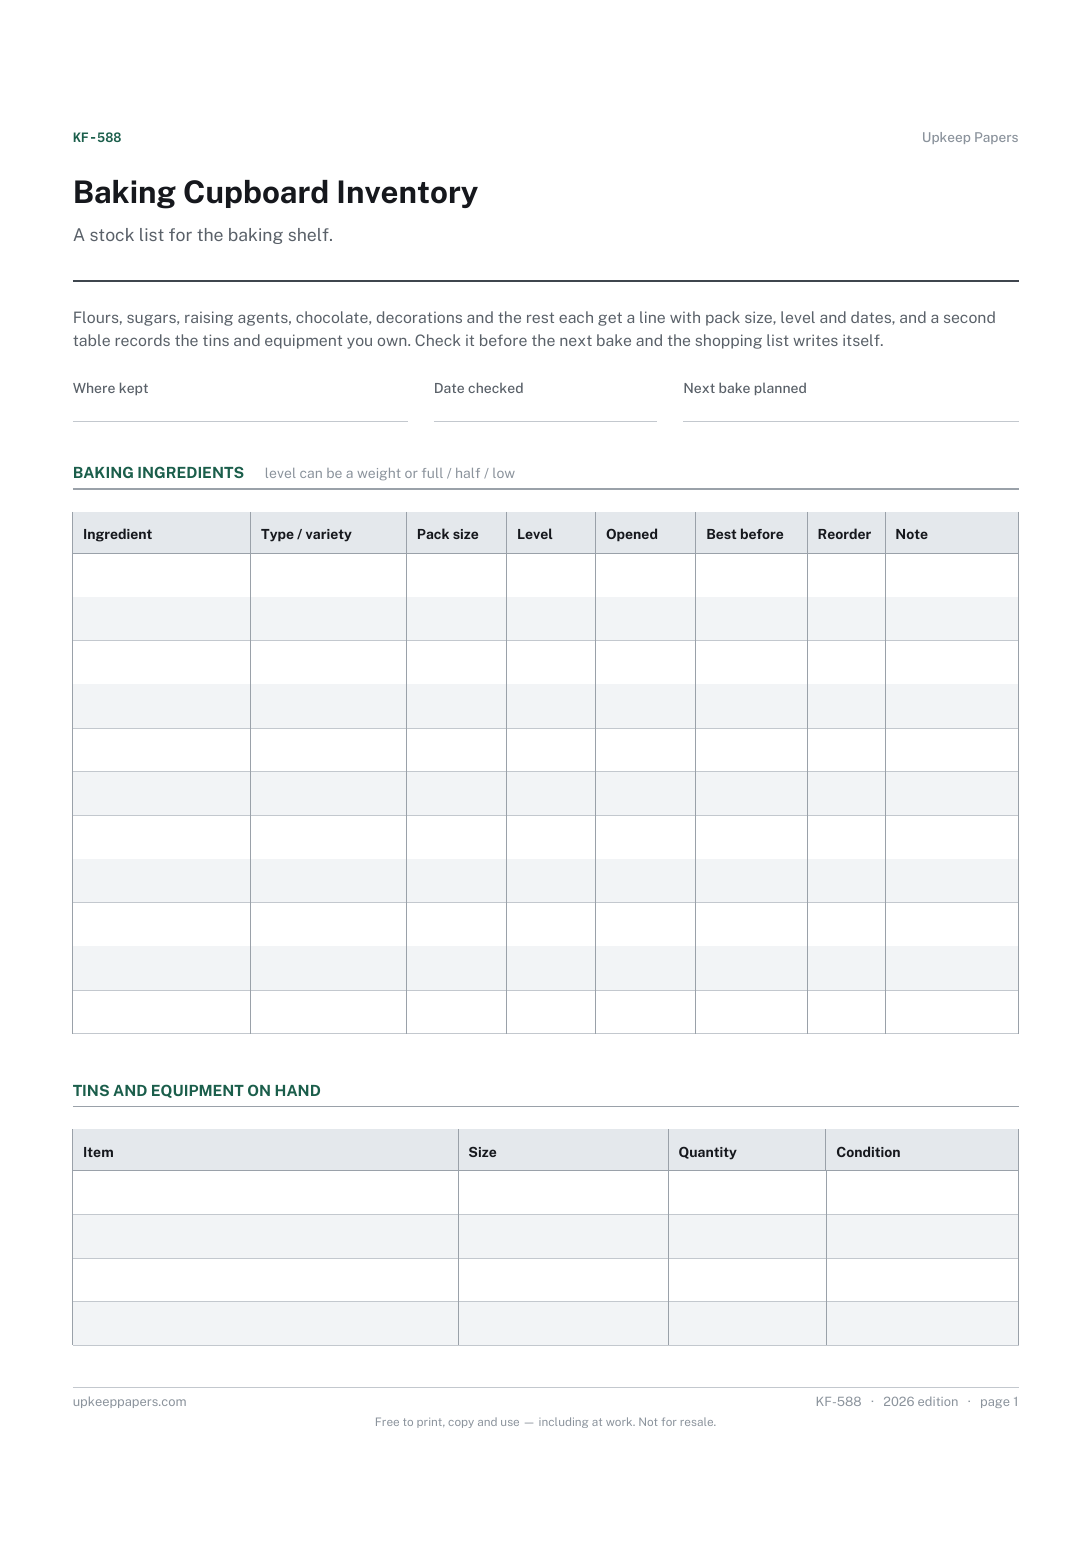
Every baking ingredient, with its type and variety.
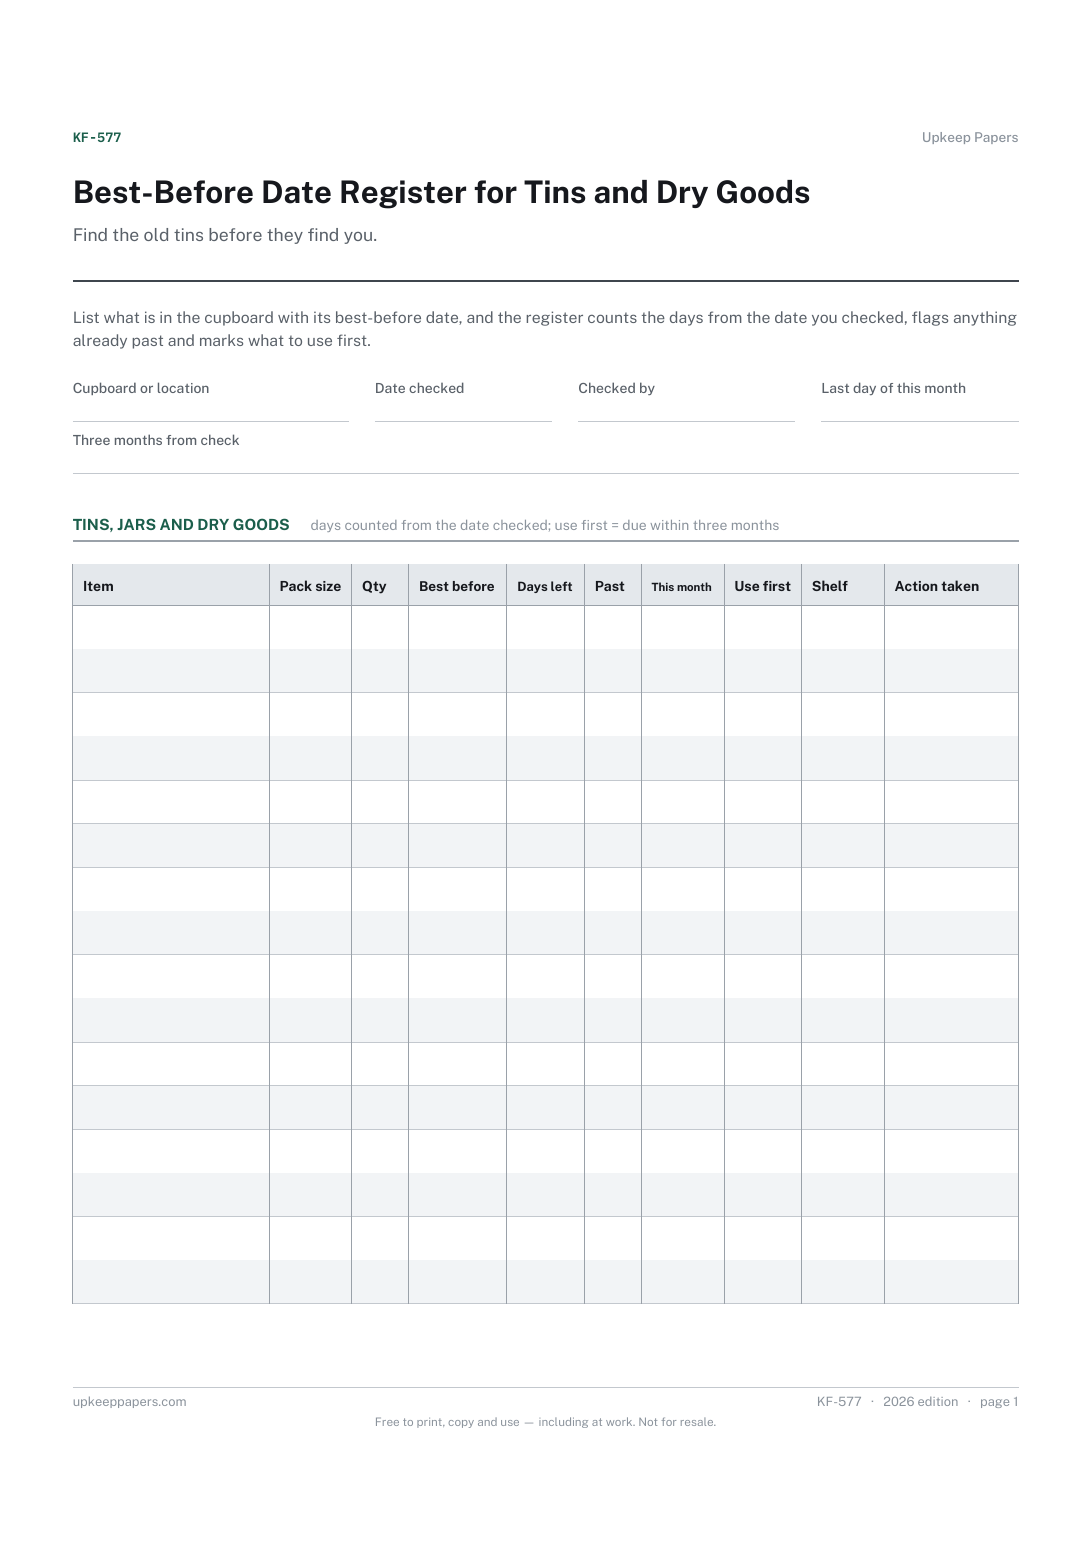
Every tin, jar and packet with its pack size, quantity and shelf.
What is in stock and where, so nothing is bought twice.
What is being eaten on every day of the week, meal by meal.

Every sheet, binder, game and puzzle on Upkeep Papers is free to download, with no email and no account. Making them is not free: each one takes days of research, design and checking, and the site costs money to run. If something here saved you time, you can buy us a coffee. It is entirely optional: nothing is locked, and nothing changes if you don’t.
Buy us a coffee Opens PayPal in a new tab. Any amount, and nothing changes if you would rather not.