LPG and Bottled Gas Usage Calculator
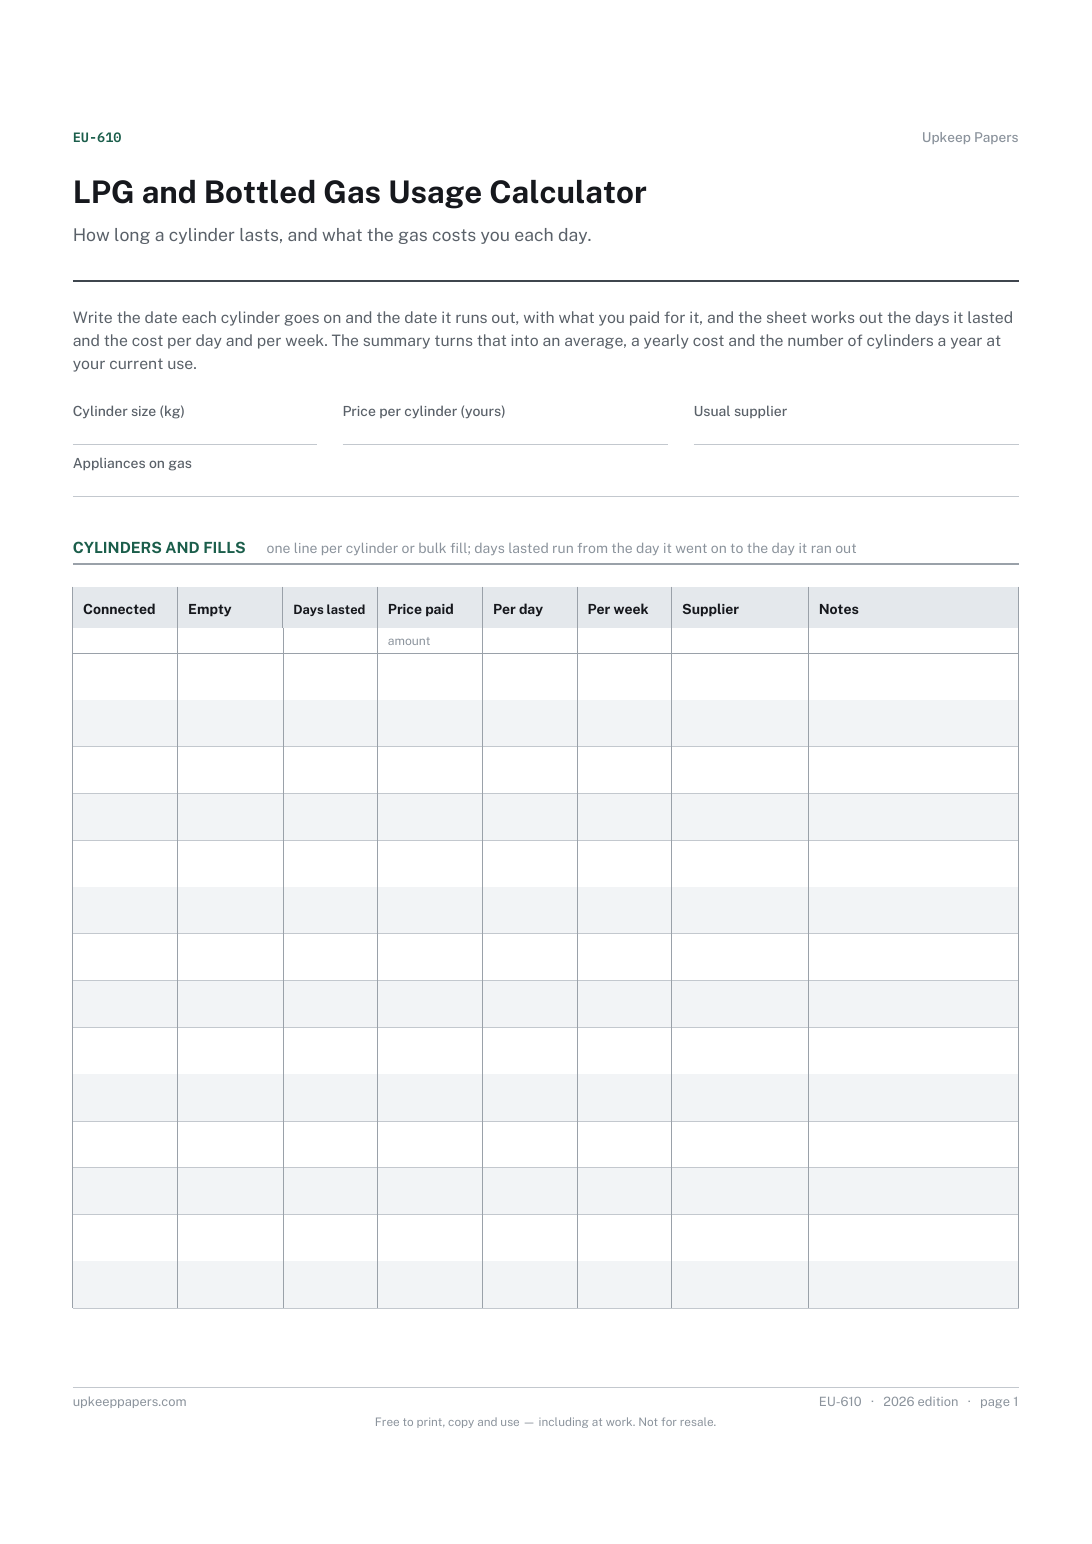
How many days each cylinder or tank fill lasted.
EU-610 Log PDF Excel Online
Everything here is free. Making it takes time and money. Everything here is free.
 Buy us a coffee
Energy and Utilities · EU-609 · Log
Free heating oil usage calculator — litres used, litres and cost per day and days left to your reorder level, from your tank readings. PDF, Excel, browser.
2 pages. The A4 and US Letter files are laid out identically, so neither is shrunk to fit.
Print it and write on it
Fillable PDF type and save
Spreadsheet formulas included
The fillable versions have real form fields — open them in any PDF reader, type into them and save. Printing help.
The same sheet, on screen. Totals and figures are worked out as you type, rows can be added or removed, and you can print it or download the completed version as a PDF. Everything stays in your browser — your entries are kept in this browser's own storage on this device, nothing is uploaded, and there is no account.
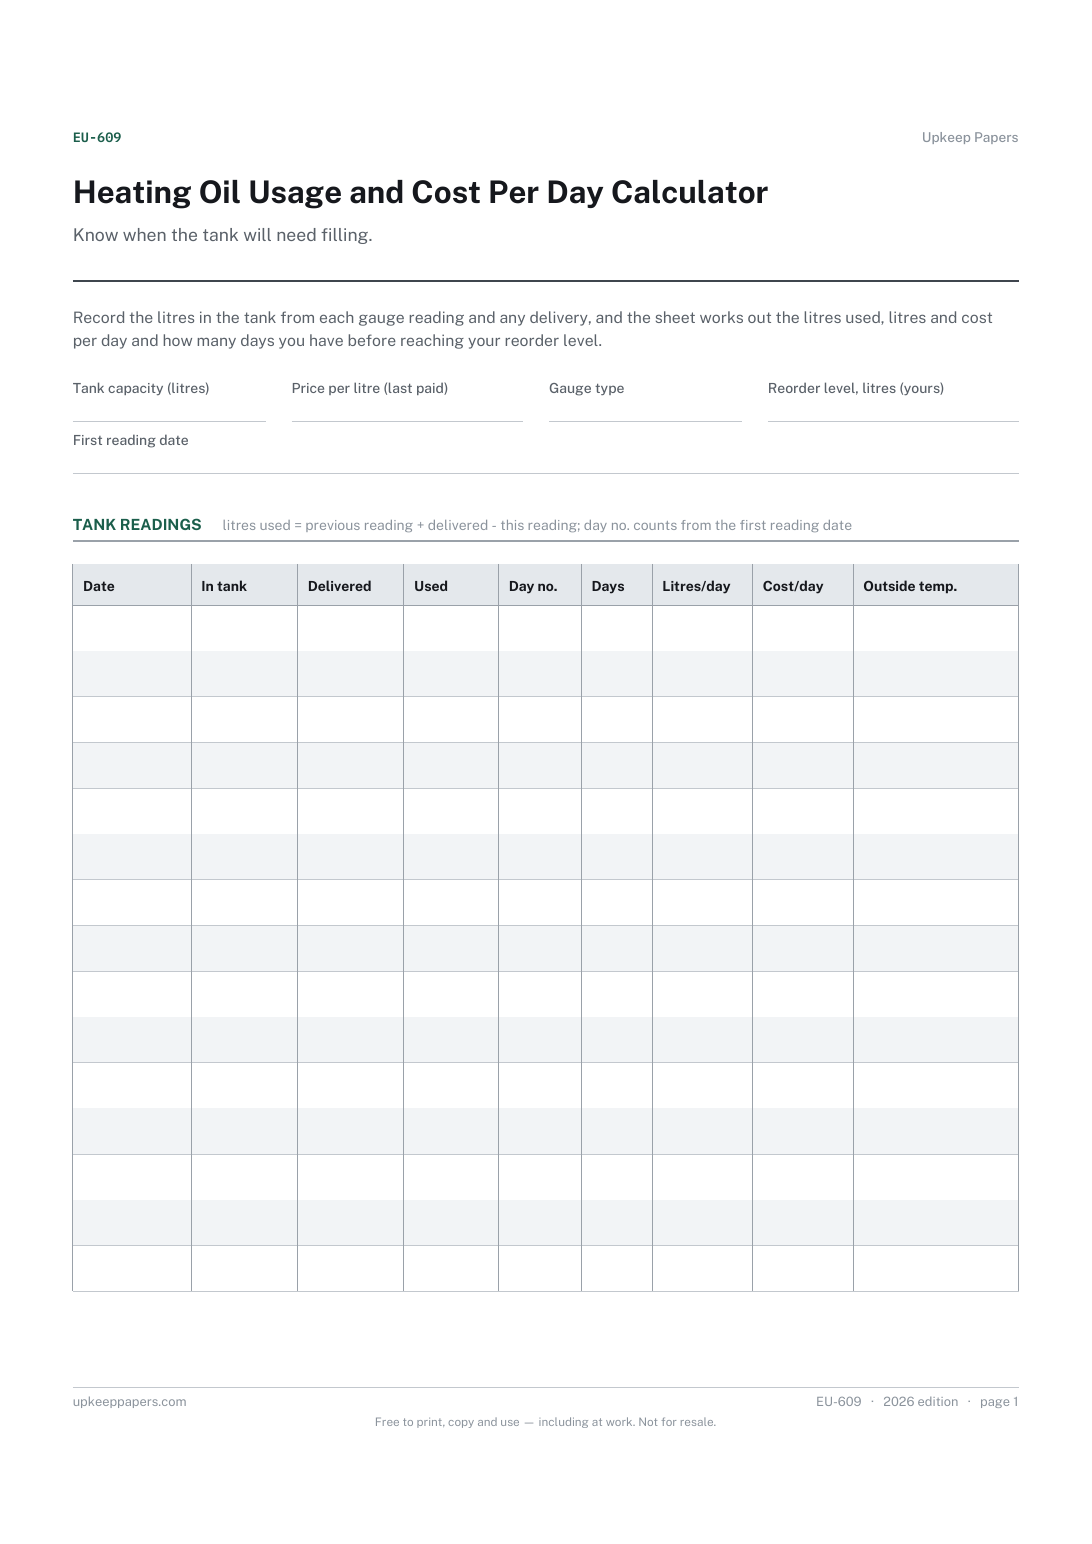
Know when the tank will need filling. Record the litres in the tank from each gauge reading and any delivery, and the sheet works out the litres used, litres and cost per day and how many days you have before reaching your reorder level.
Oil-heated homes off the gas grid, and anyone who has run out in January and wants enough warning to order at a time of their choosing.
The printable is laid out inside a box that fits both A4 and US Letter, so the two files are identical and neither one is scaled. The fillable PDF has real form fields. The workbook uses plain formulas only — SUM, IF, COUNTIF and the like — so it opens in Excel, LibreOffice and Google Sheets without anything breaking, and every calculated cell is grey so you can see which figures it worked out.
Download the A4 or US Letter file to match the paper in your printer, open it in a PDF reader and print at 100% — not "fit to page", which shrinks the writing space. Both files leave a 14 mm margin, which clears the unprintable edge on home printers. To print the online version with your entries in it, use the Print this sheet button, which prints only the sheet and none of the page around it. More on printing.
Many gauges read in litres or as a fraction of the tank. For a fraction, multiply by the tank's capacity; for a dipstick, use the tank maker's chart. Tank shape means a fraction is only approximate.
One that suits you: enough to cover the time a delivery takes where you live and a cold snap while you wait. The sheet does not suggest a figure; it counts the days down to whichever one you choose.
Enter the litres delivered on the line where the new reading is taken. Litres used is the previous reading plus the delivery minus the new reading, so a refill does not show as negative use.
It uses your average so far, and oil use rises and falls with the weather. Early in the season the average is low; the outside temperature note helps explain the swings.
How many days each cylinder or tank fill lasted.
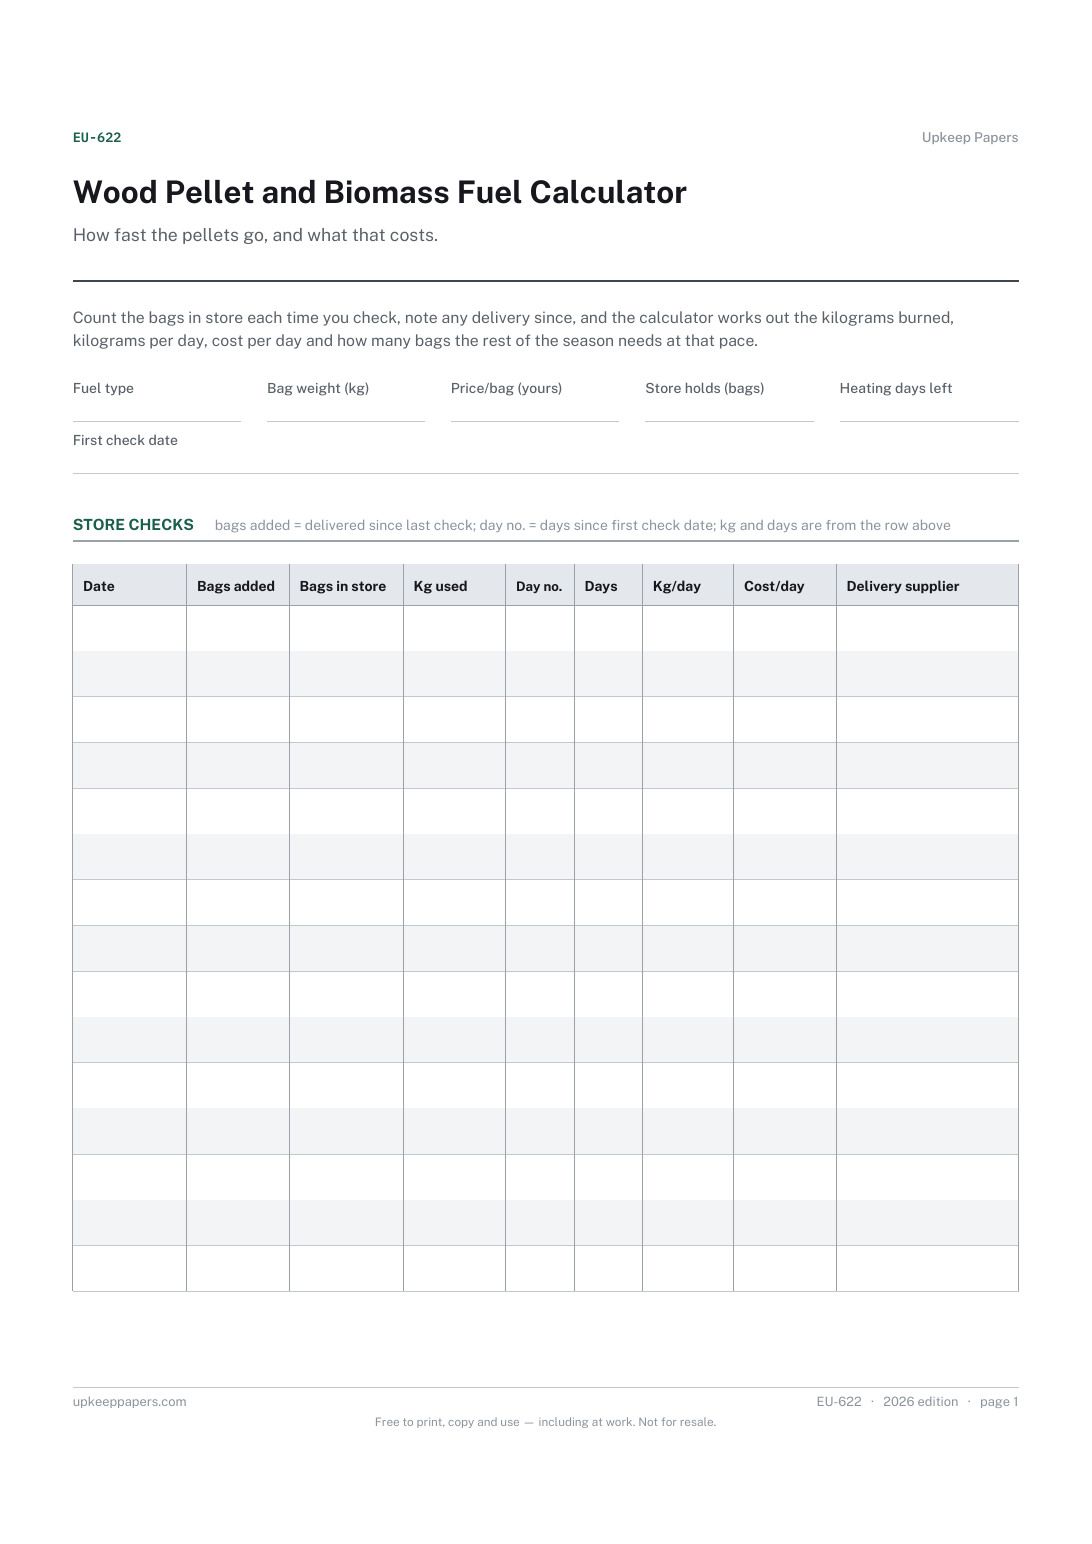
Bags delivered and bags left in store at each check.
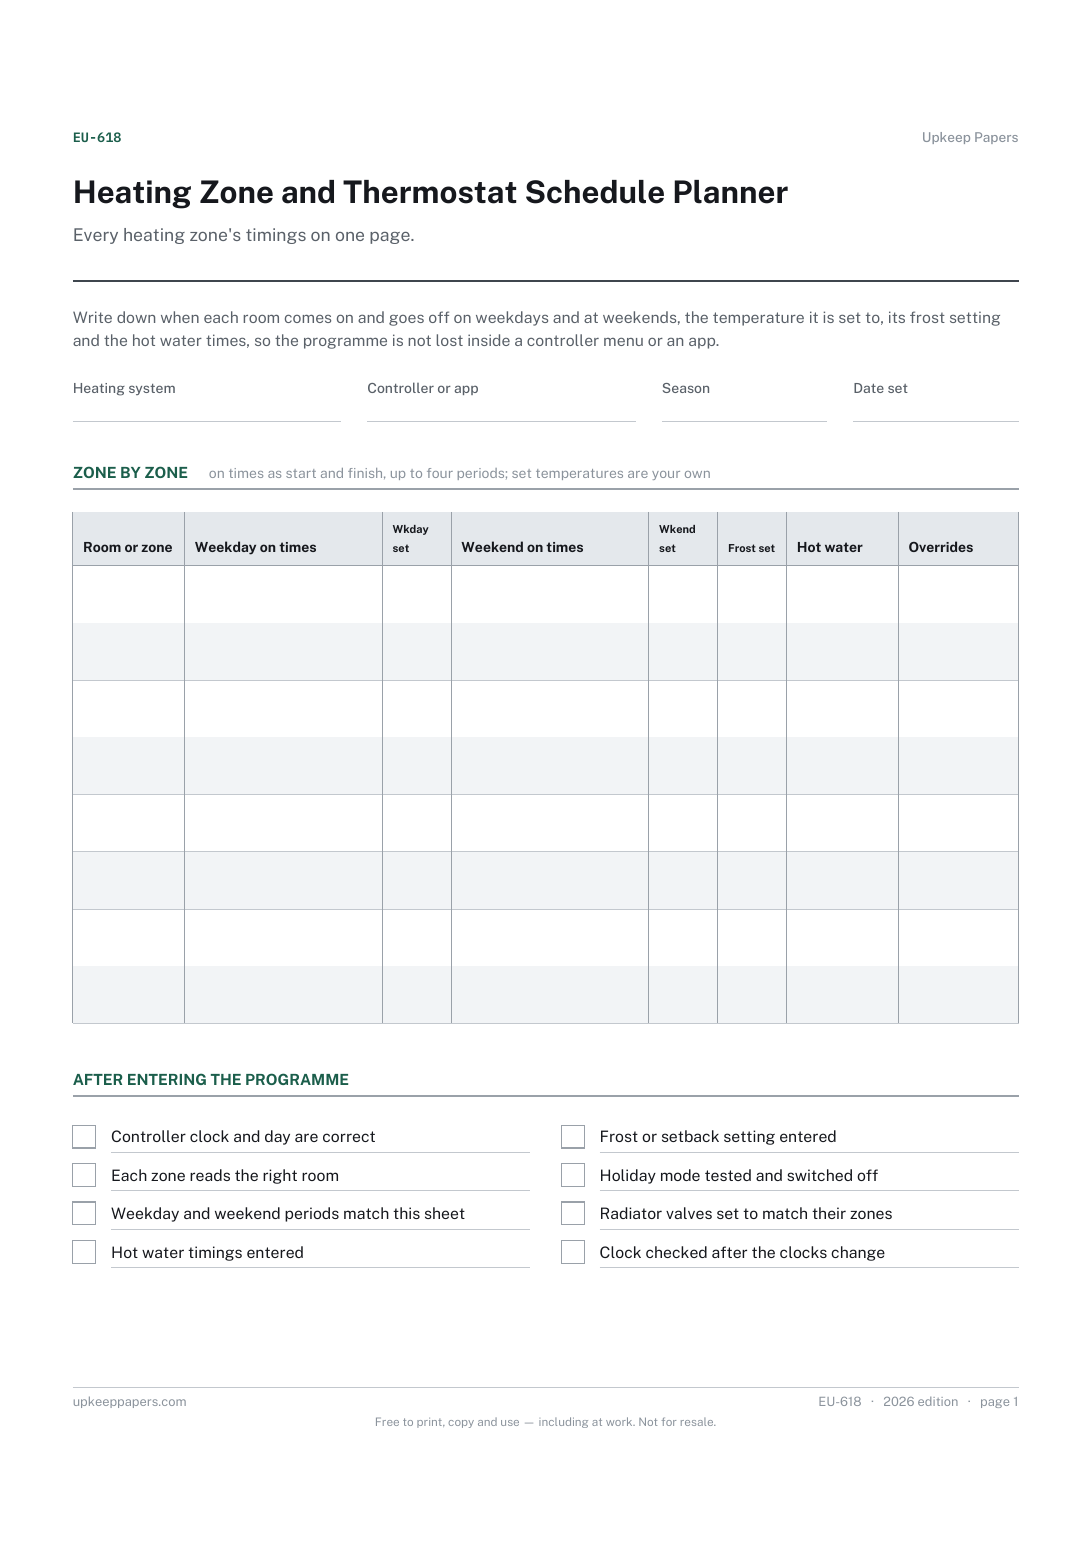
The on and off periods for each room on weekdays and at weekends.
Printable sheets, workbooks and tools on the same subject.
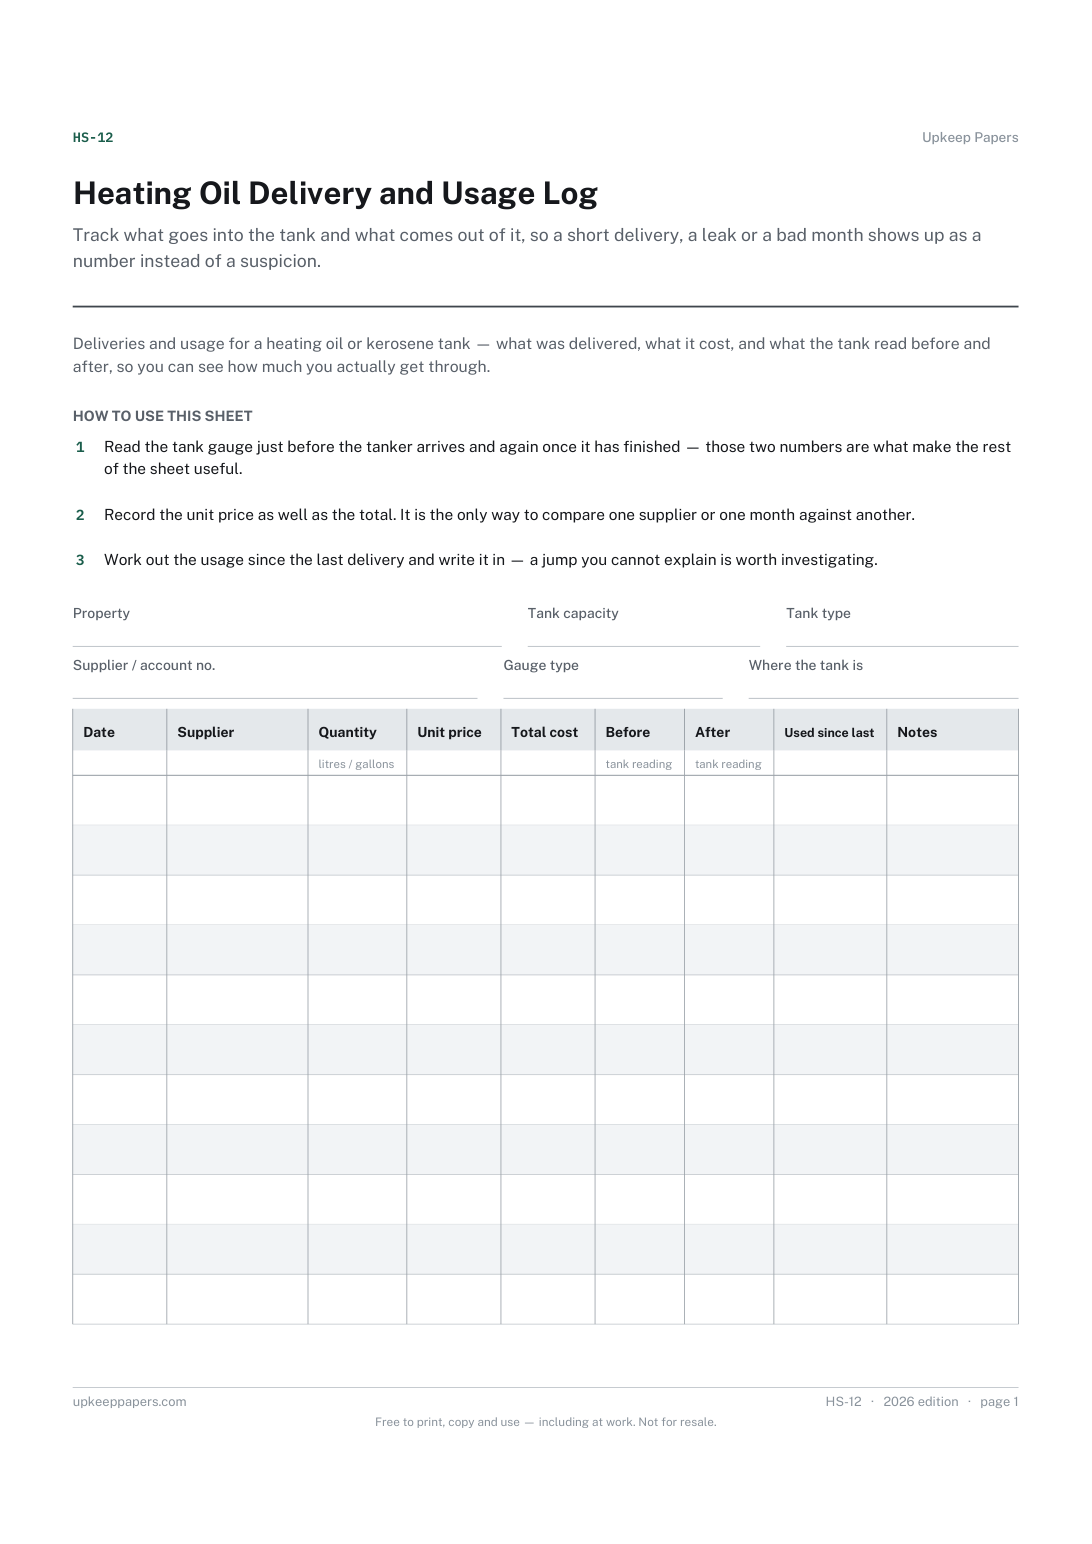
Track what goes into the tank and what comes out of it, so a short delivery, a leak or a bad month shows up as a number instead of a suspicion.

Every sheet, binder, game and puzzle on Upkeep Papers is free to download, with no email and no account. Making them is not free: each one takes days of research, design and checking, and the site costs money to run. If something here saved you time, you can buy us a coffee. It is entirely optional: nothing is locked, and nothing changes if you don’t.
Buy us a coffee Opens PayPal in a new tab. Any amount, and nothing changes if you would rather not.