Money Calculators and Worksheets · MC-1041 · Form
Personal Inflation Rate Calculator
Personal inflation calculator: what your household paid for the same things a year apart, by category, and your own overall rate of rise. Excel, PDF, browser.
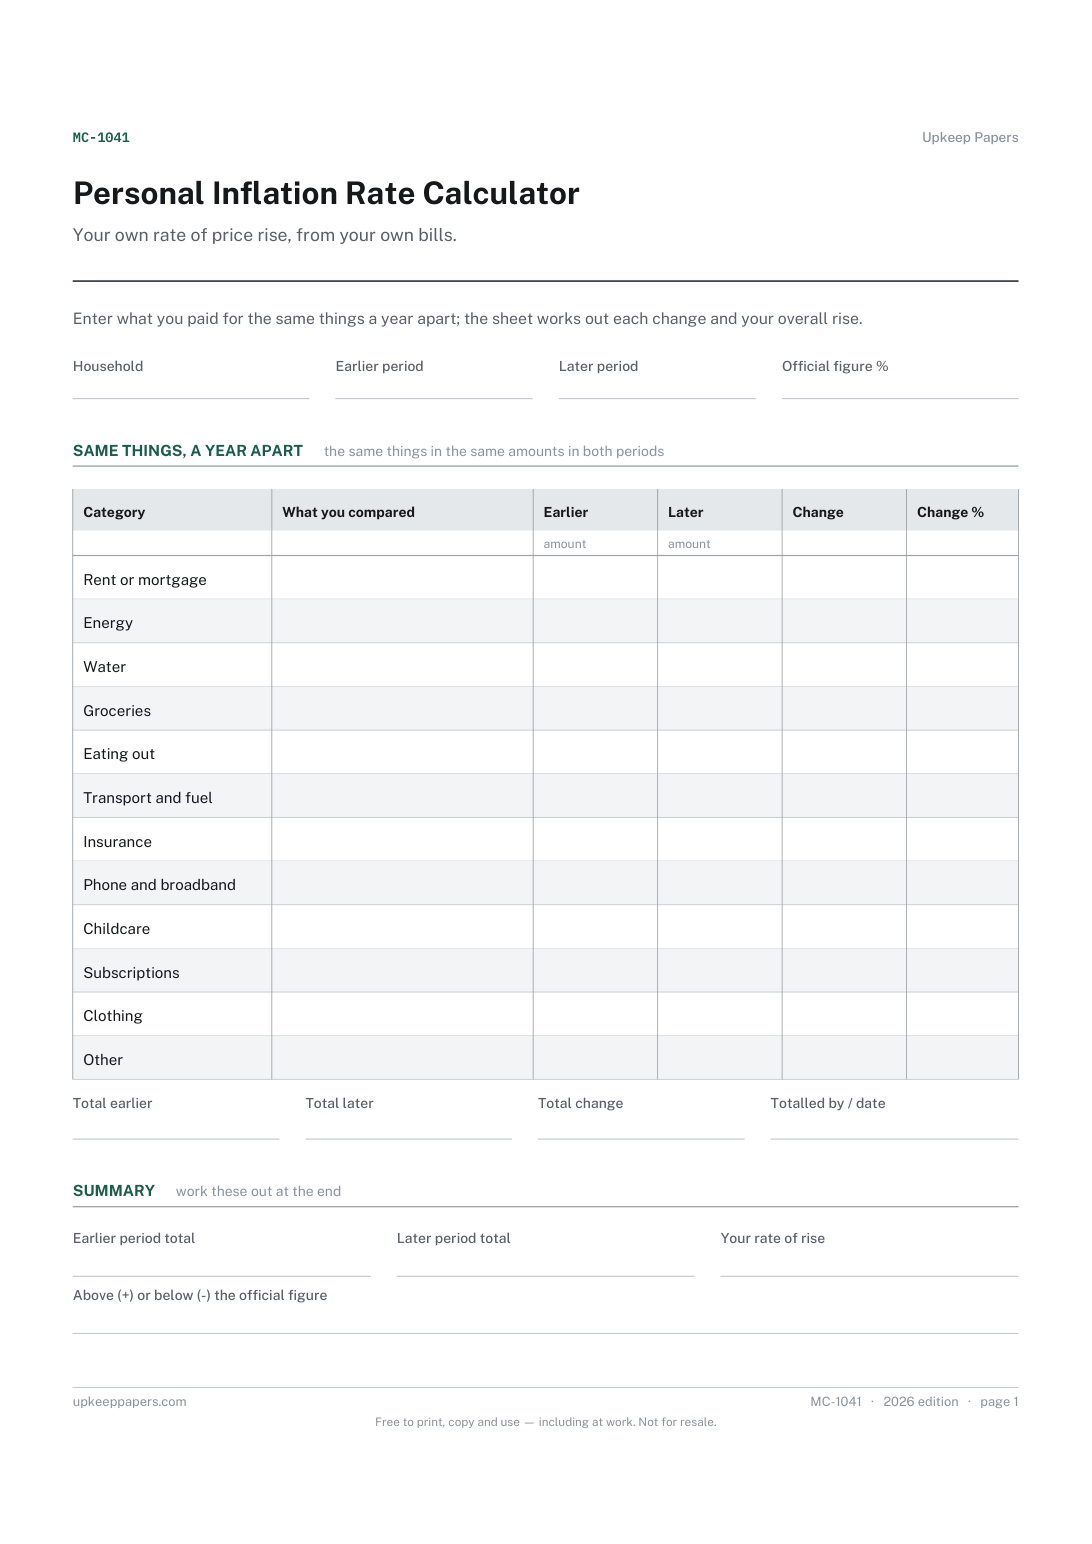
One page. The A4 and US Letter files are laid out identically, so neither is shrunk to fit.
Print it and write on it
Fillable PDF type and save
Spreadsheet formulas included
The fillable versions have real form fields — open them in any PDF reader, type into them and save. Printing help.
Fill it in online
The same sheet, on screen. Totals and figures are worked out as you type, rows can be added or removed, and you can print it or download the completed version as a PDF. Everything stays in your browser — your entries are kept in this browser's own storage on this device, nothing is uploaded, and there is no account.
Who this is for
Your own rate of price rise, from your own bills. Enter what you paid for the same things a year apart; the sheet works out each change and your overall rise.
Households who feel their costs have risen faster or slower than the headline figure, and anyone preparing for a pay or pension conversation who wants their own numbers.
What this helps you track
- What you paid in each category in two periods a year apart
- The change in money and as a percentage for each category
- Which categories have risen most for your household
- Your overall rise, weighted by what you actually spend
- How your figure compares with the official one you look up
How to use it
- Choose two matching periods a year apart, such as the same month or quarter, and write them at the top.
- For each category, enter what you paid in each period for the same things in the same amounts, from bills, statements and receipts.
- Say what you compared in each row, such as the same weekly shop or the same usage on the same tariff, so the comparison is like for like.
- Look up the official figure for the same period from your national statistics office and write it at the top.
- The changes, your overall rise and the comparison are worked out in the browser and the workbook; on paper, subtract and divide.
Formats
- Printable PDF (A4 and US Letter)
- Fillable PDF with form fields
- Fill in online, saved in your browser
- Excel / Google Sheets workbook
The printable is laid out inside a box that fits both A4 and US Letter, so the two files are identical and neither one is scaled. The fillable PDF has real form fields. The workbook uses plain formulas only — SUM, IF, COUNTIF and the like — so it opens in Excel, LibreOffice and Google Sheets without anything breaking, and every calculated cell is grey so you can see which figures it worked out.
How to print
Download the A4 or US Letter file to match the paper in your printer, open it in a PDF reader and print at 100% — not "fit to page", which shrinks the writing space. Both files leave a 14 mm margin, which clears the unprintable edge on home printers. To print the online version with your entries in it, use the Print this sheet button, which prints only the sheet and none of the page around it. More on printing.
Questions
Why is my rate different from the official one?
The official figure averages the spending of many households. Yours weights each category by what you actually spend, so a household that spends more on energy or rent sees those prices count for more.
What if we used more or less of something?
Then the change mixes price and quantity. For a price comparison, compare the same items or the same usage, such as the unit price on an energy bill, and say what you did in the compared column.
How is the overall figure worked out?
The total paid in the later period less the total in the earlier one, divided by the earlier total. That weights every category by its share of what you spent in the earlier period.
Where do I find the official figure?
Your national statistics office publishes it, usually each month. Use the figure for the same twelve months as yours, and note its source and date in the browser version or on the back of the sheet.
Related resources
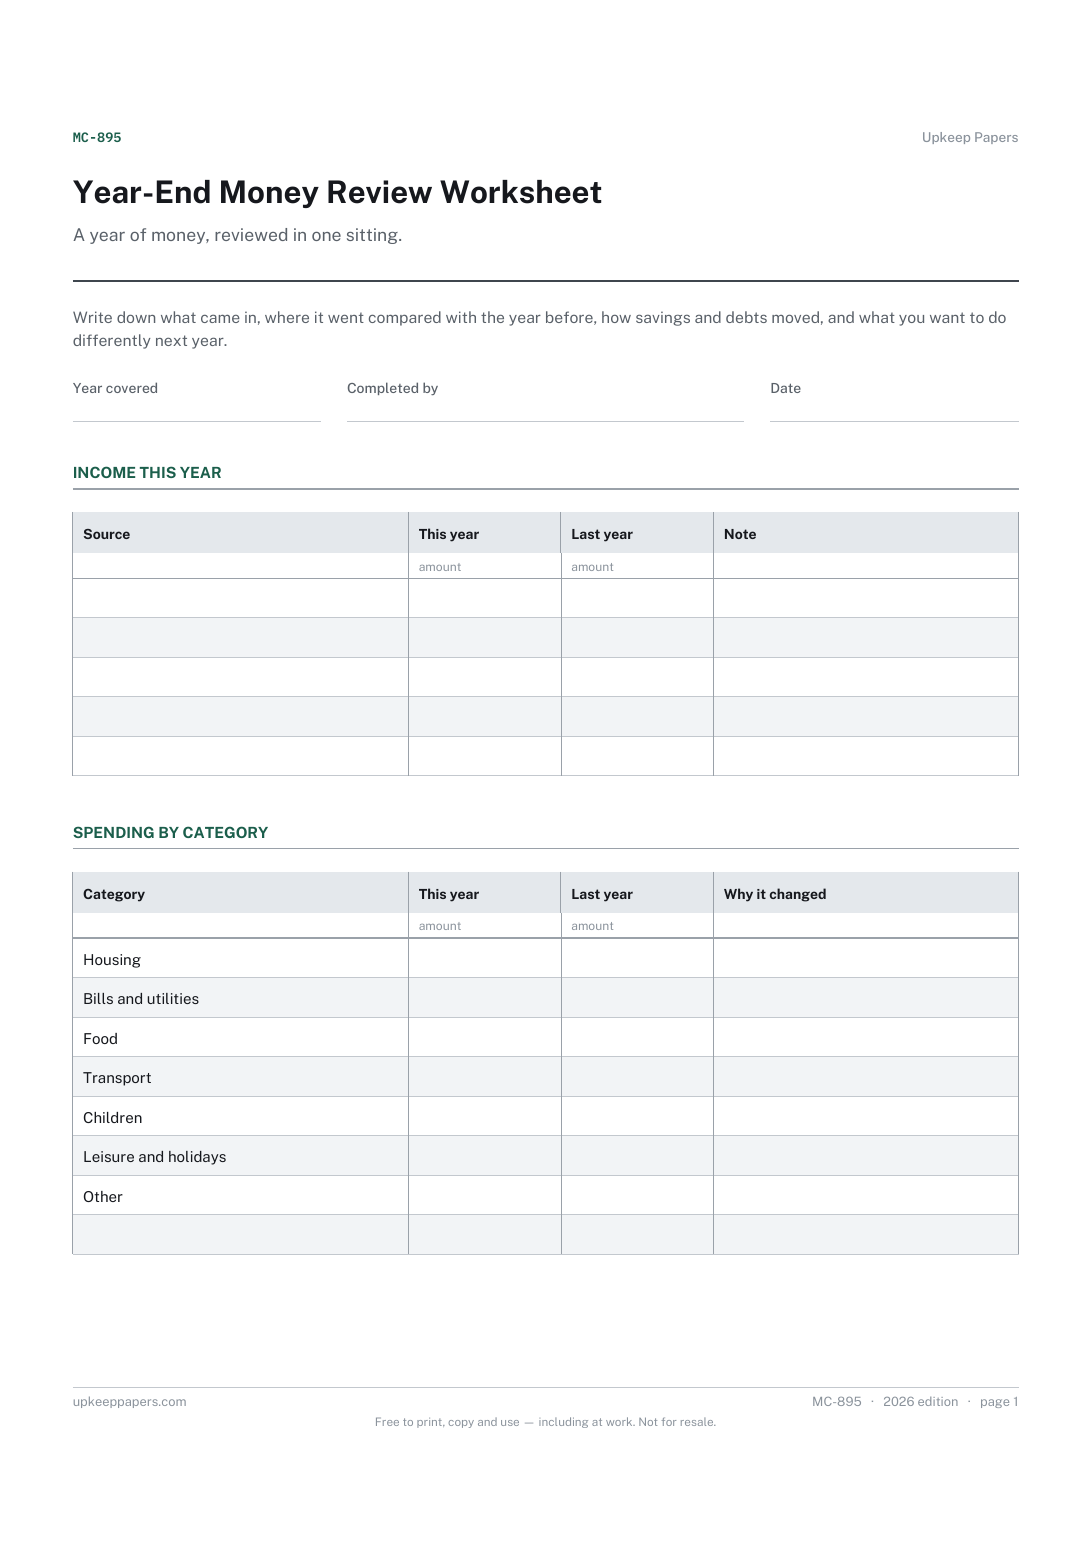
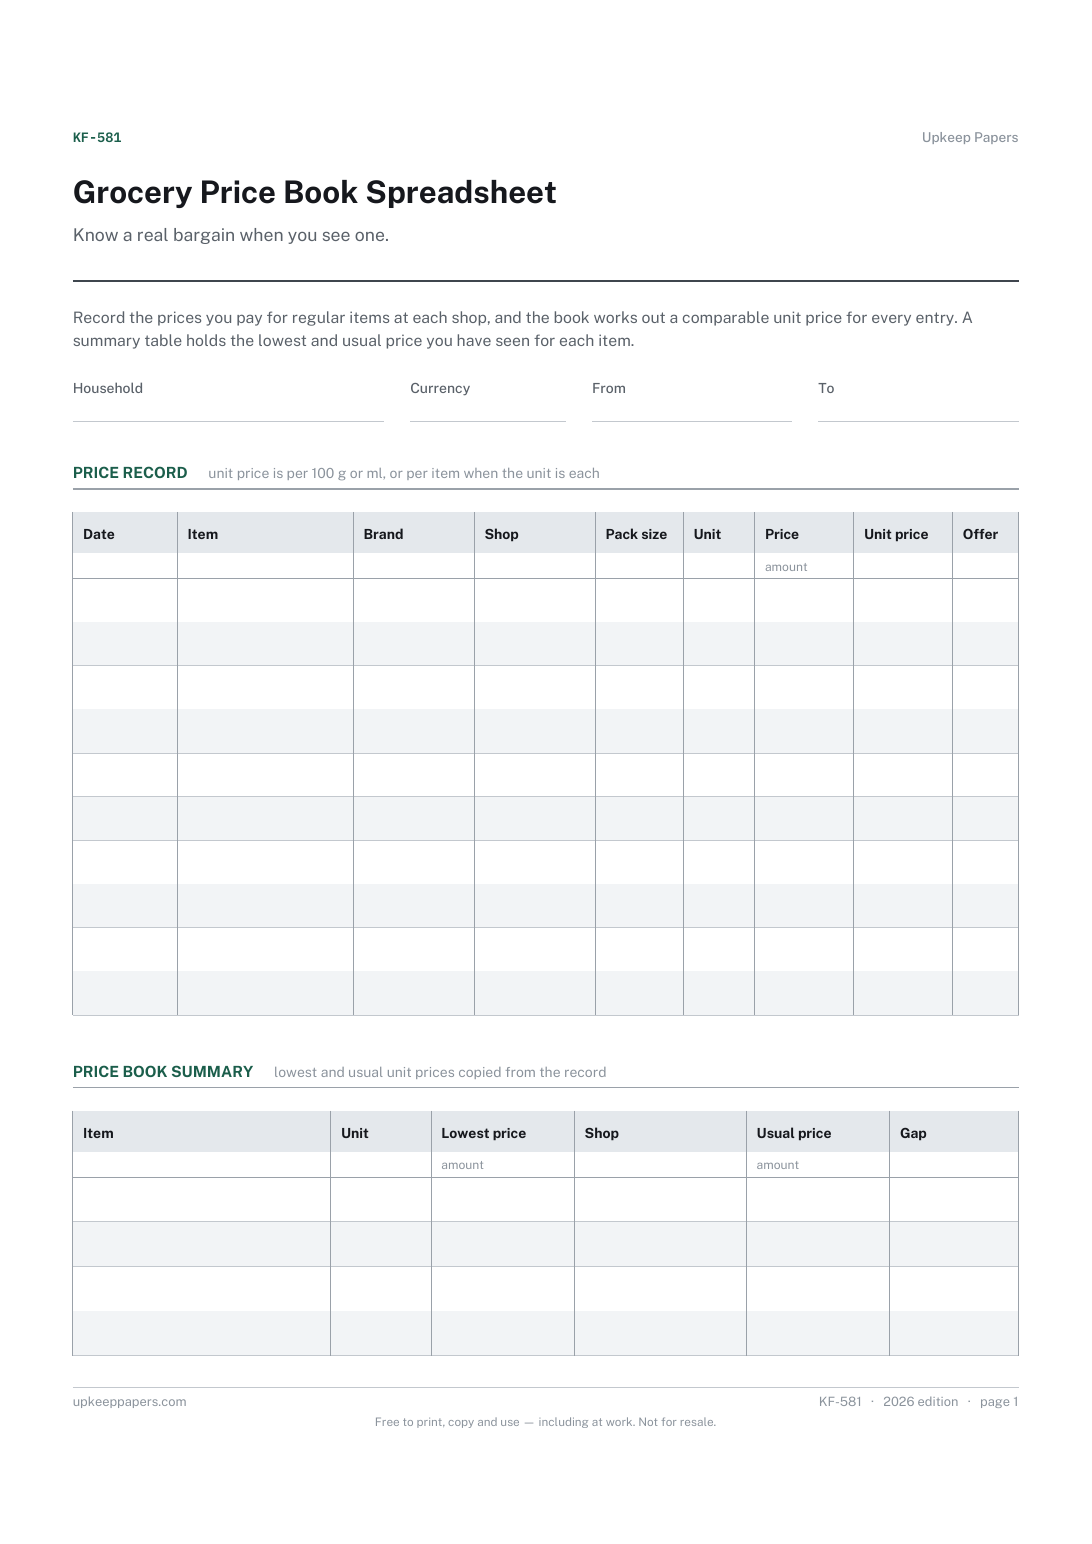
Grocery Price Book Spreadsheet
What you paid for each regular item, where and when.
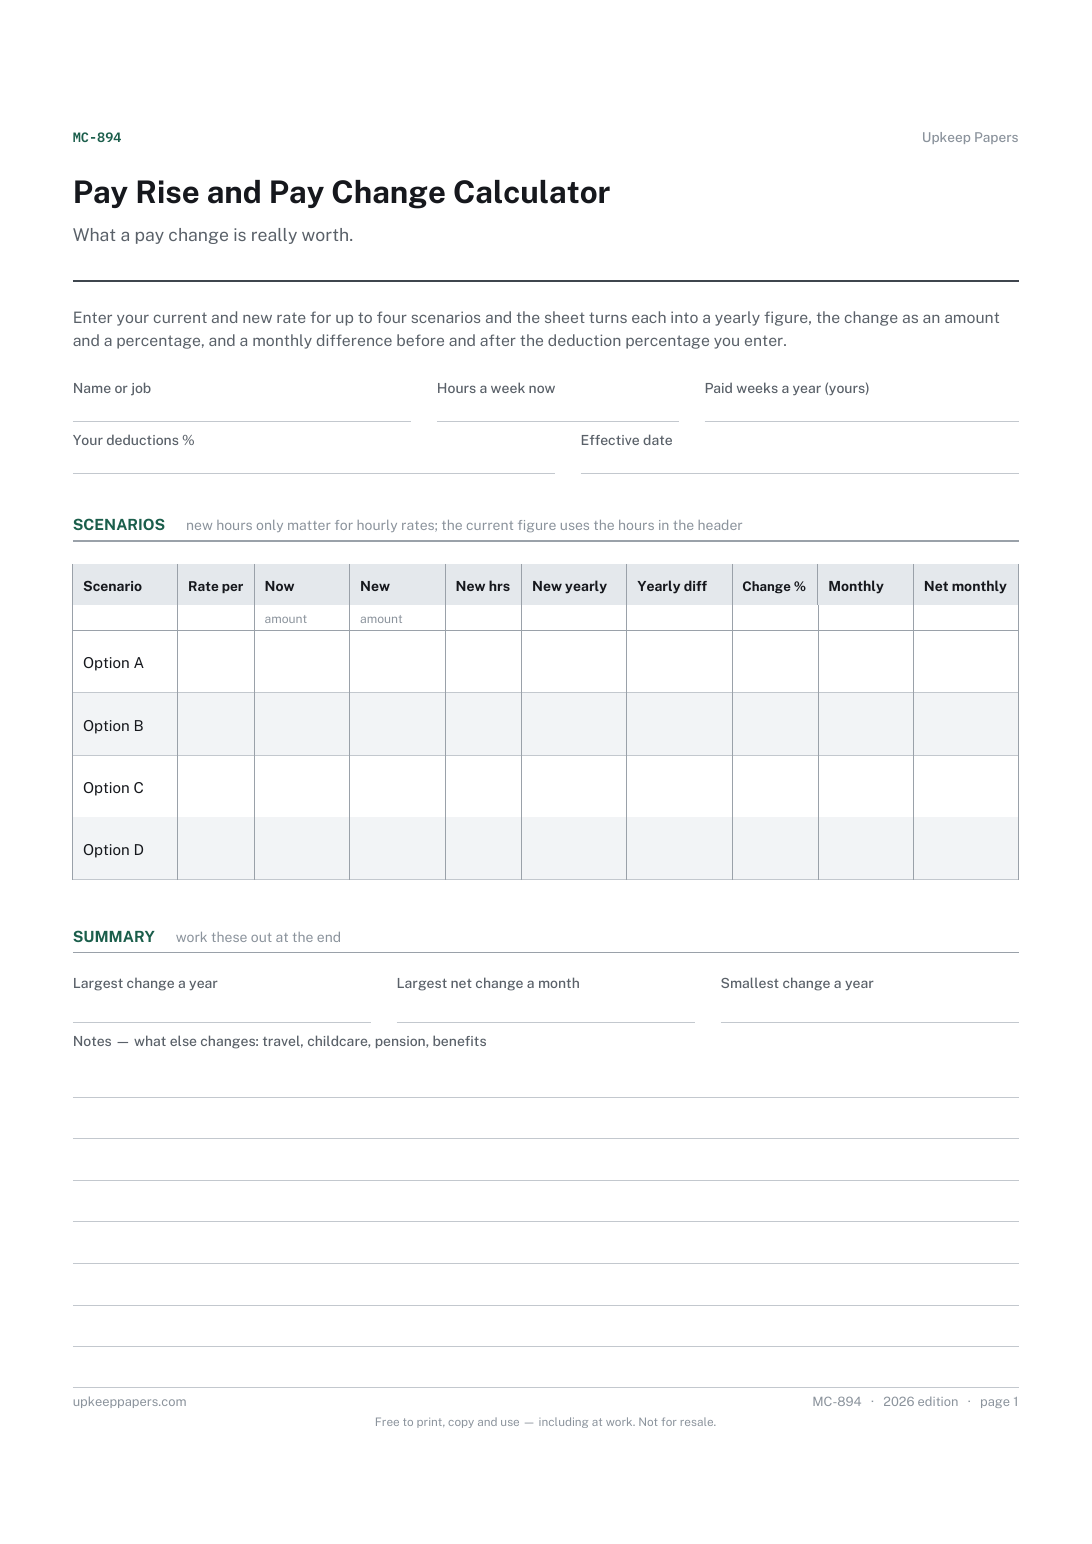
Pay Rise and Pay Change Calculator
Your current and new pay on the same yearly basis.
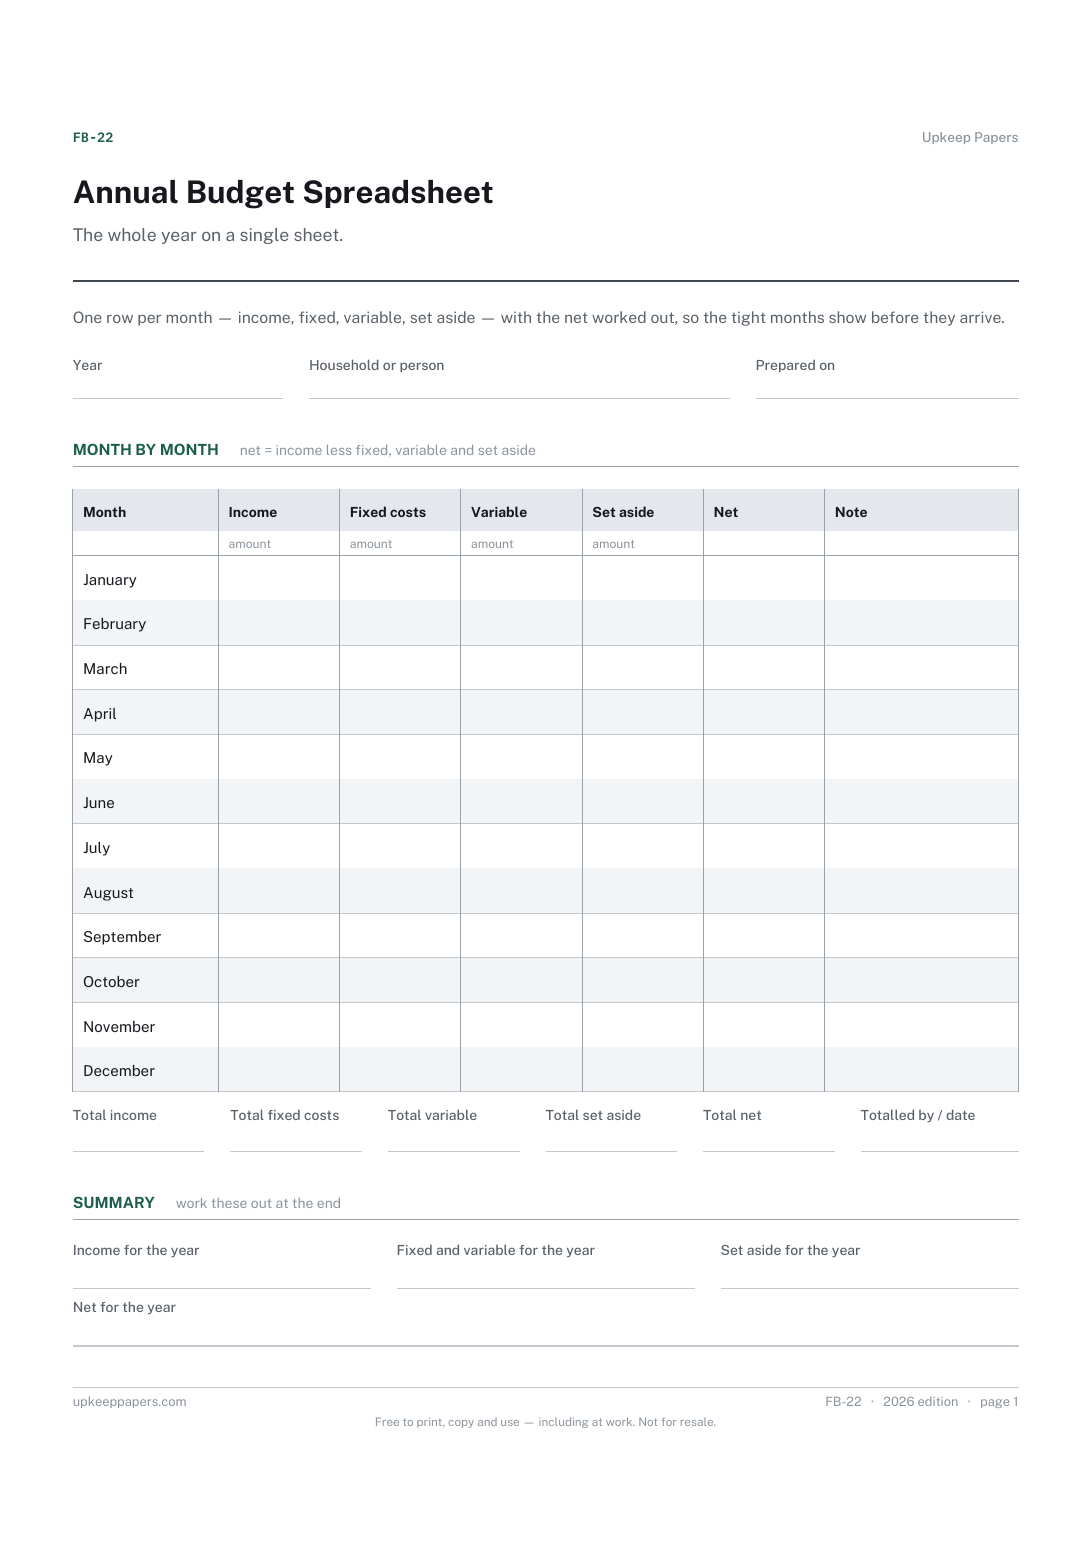
Annual Budget Spreadsheet
Income and outgoings for every month of the year in one view.
Also in the library
Printable sheets, workbooks and tools on the same subject.

Household Budget Spreadsheet
A monthly budget that adds up planned against actual, keeps income, outgoings and saving apart, and rolls twelve months into a year view.

Utility Usage and Cost Spreadsheet
Meter readings turned into usage and cost per period, so a bill can be checked against what the meter actually did rather than taken on trust.